Check out the latest ‘What the numbers say’ column in the Economist’s 1843 magazine, which tackles food and drink spending in the USA and is free to look at online.
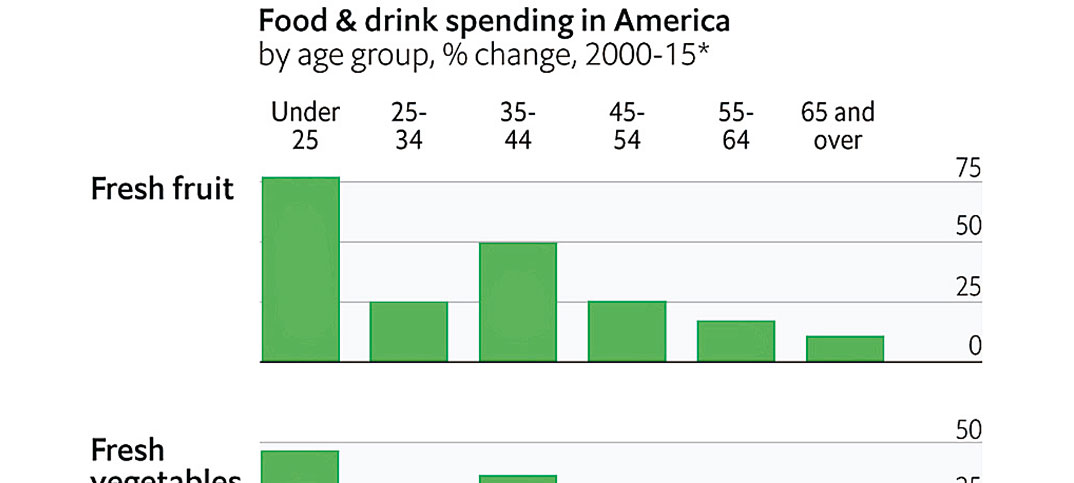
Journalist Guy Scriven has gathered data to show changes in spending in six categories from 2000 to 2015, split by age group. He believes the trends shown for the USA are closely matched in the UK.
Everyone is buying more fresh fruit, with under 25 year olds spending 75% more. Most people are buying more fresh vegetables, with the under-25s leading again with spending up by just under 50%.
On non-alcoholic drinks the under-25s are tied for the lead with the 65 and overs, both up by around 30%. On alcohol, the under-25s are spending 50% less than their 2000 counterparts, while the over- 65s lead with spending up 25%.
Remarkably, the under-25s are the only group to spend more on meat, fish and eggs. And everyone is spending less on tobacco products.
The numbers exclude spending on dining out. “As Americans get richer, they are spending a smaller share of their income on food and drink,” Scriven writes in his analysis. “About one-eighth of their budgets now go towards keeping stomachs full.
Different age groups shop differently and you should build your store around the habits of the people who are local to you
“But dining out accounts for 42% of Americans’ food budgets, up from 26% in 1970.”
What makes this data interesting is this is the sort of information retailers are expected to make business decisions on the back of. For a local shop owner the first message seems to be that food to go is important and better for you products are in demand.
However, data is always tricky. These charts are unweighted. If the under-25s are fewer in number and spending less than the 35 to 44s, for example, how do you treat their spending pattern? If the 25-34 year-olds, who are spending less on non-alcoholic drinks, spent more when they were under the age of 25 how do you plan for future sales?
And the dining out statistic seems to belong to a different data set and one that stretches back 25 years further into the past. Did Scriven choose this data because the 2000 comparison was less dramatic? Or was it not available?
He uses the data to say: “Doctors and parents both tell young people to eat healthily and drink in moderation, and the young finally seem to be listening.” But this is aggregate data for lots of people and local shops have to look after local people.
At present, local data for local businesses is highly expensive and difficult to come by. This means that smaller operators, who typically find data hard to use, have very little information to anchor their business decisions on.
But at a glance the Economist’s chart shows some important rules. Different age groups shop differently and you should build your store around the habits of the people who are local to you. If you are appealing to students, then trends affecting young people are important. If you are appealing to the 65 and over group, then you need to embrace what they want to buy.
Because here is the thing: the number of people aged 65 and over is only going to grow. Pay attention to all the data you can get but make sure you only act on data about your customers.
Comments
This article doesn't have any comments yet, be the first!